Perf ormance Graph
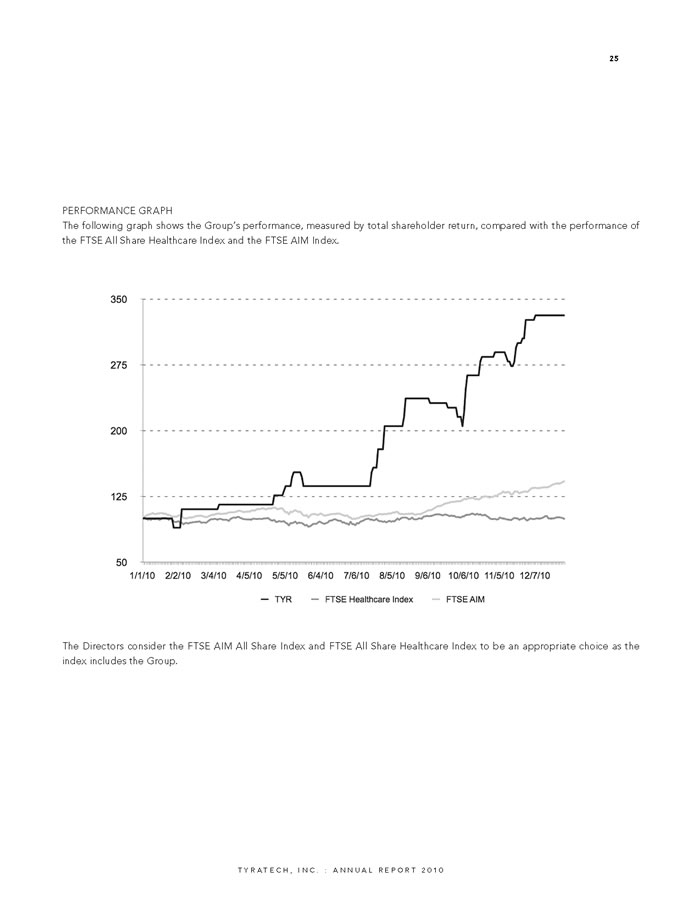
The following graph shows the Group's performance, measured by total shareholder return, compared with the performance of
the FTSE All Share Healthcare Index and the FTSE AIM Index.
The Directors consider the FTSE AIM All Share Index and FTSE All Share Healthcare Index to be an appropriate choice as the
index includes the Group.
25
T y r a T e c h , I n c . : A n n u a l R e p o rt 2 0 1 0