TyraTech, Inc. Annual Report 2008
21
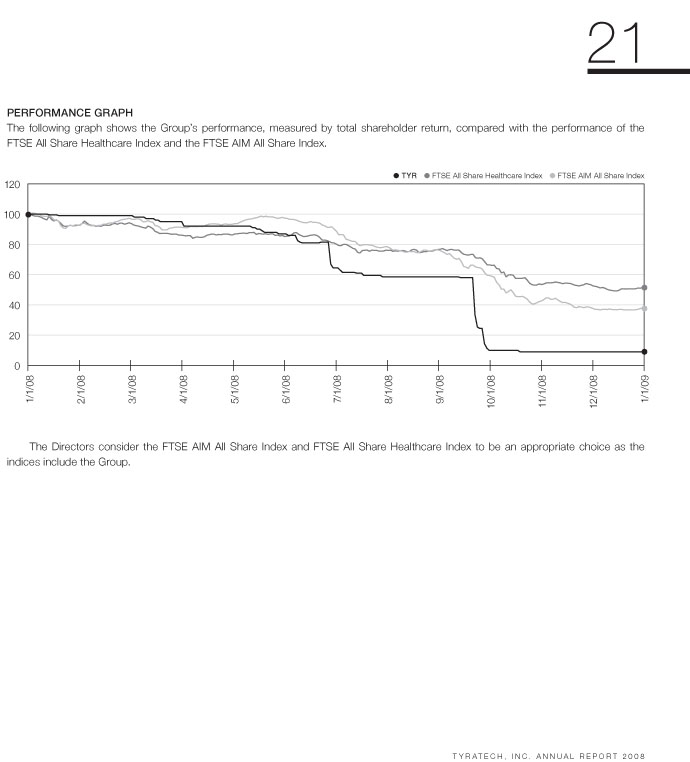
Perfrformance GrGraph
The following graph shows the Group´s performance, measured by total shareholder return, compared with the performance of the FTSE All Share Healthcare Index and the FTSE AIM All Share Index.
The Directors consider the FTSE AIM All Share Index and FTSE All Share Healthcare Index to be an appropriate choice as the indices include the Group.
1/1/08
2/1/08
3/1/08
4/1/08
5/1/08
6/1/08
7/1/08
8/1/08
9/1/08
10/1/08
11/1/08
1/1/09
12/1/08
120
80
40
100
60
20
0
TYTYR FTSE All Share Healthcare Index FTSE AIM All Share Index